
View Analytics
Check followers, impressions, interactions, and posts for any period, and see how each channel is doing.
Open Insights. Select Insights in the left navigation. It opens on Analytics. Reports and Goals are in the menu beside it.
Choose a period. Use the menu at the top left to pick This week, This month, This quarter, This year, or Custom. Everything on the page updates to match.
Read the Overview. Four cards show your totals for Followers, Impressions, Interactions, and Posts. Next to each total, you see how every connected channel contributed. Scroll down to Channels side by side for a chart of followers by channel.
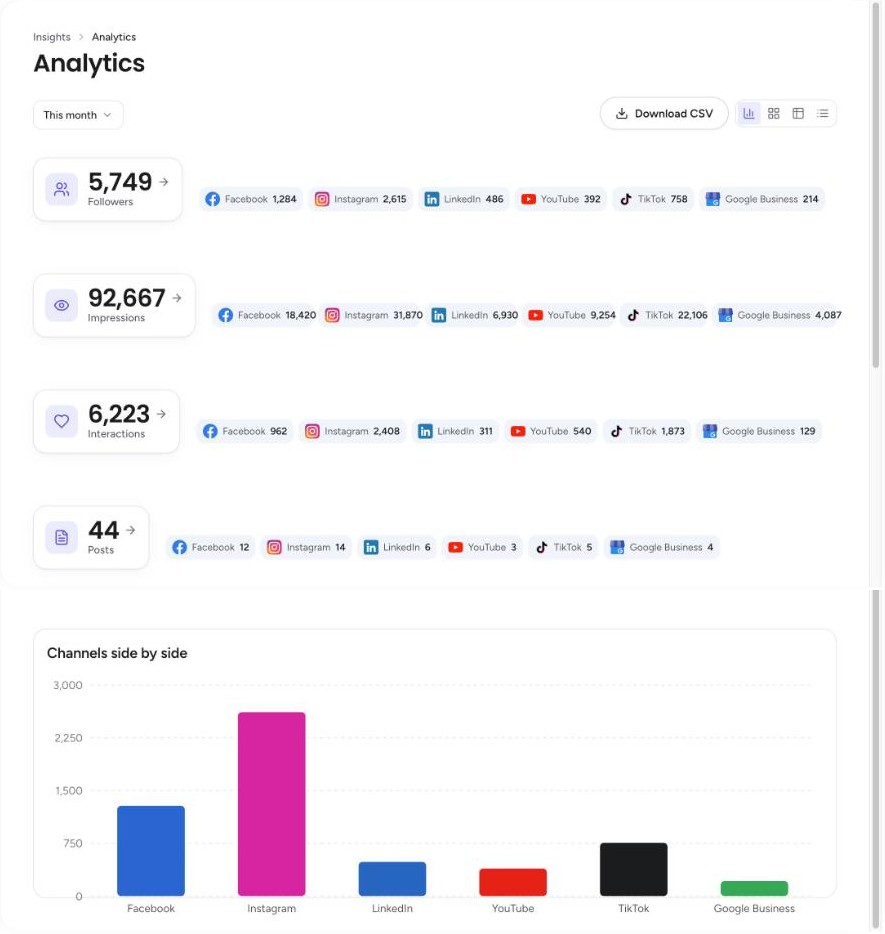
Switch views. The four buttons next to Download CSV change how the same numbers are shown: Overview, By channel, Table, and Posts.
Compare channels with By channel. Each channel gets its own card with its four numbers, so you can see them side by side.

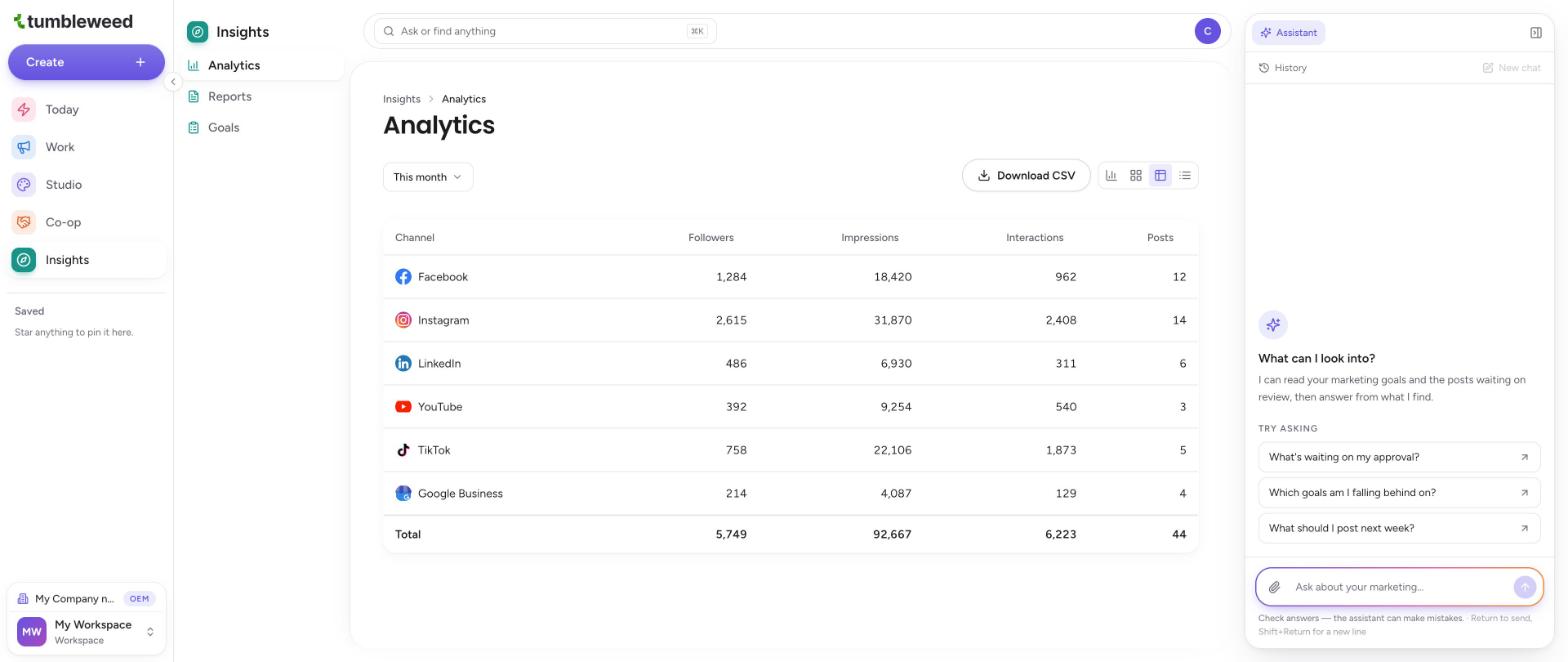
Scan the numbers in Table. The Table view lists one row per channel, with a Total row at the bottom. Select a column heading to sort.
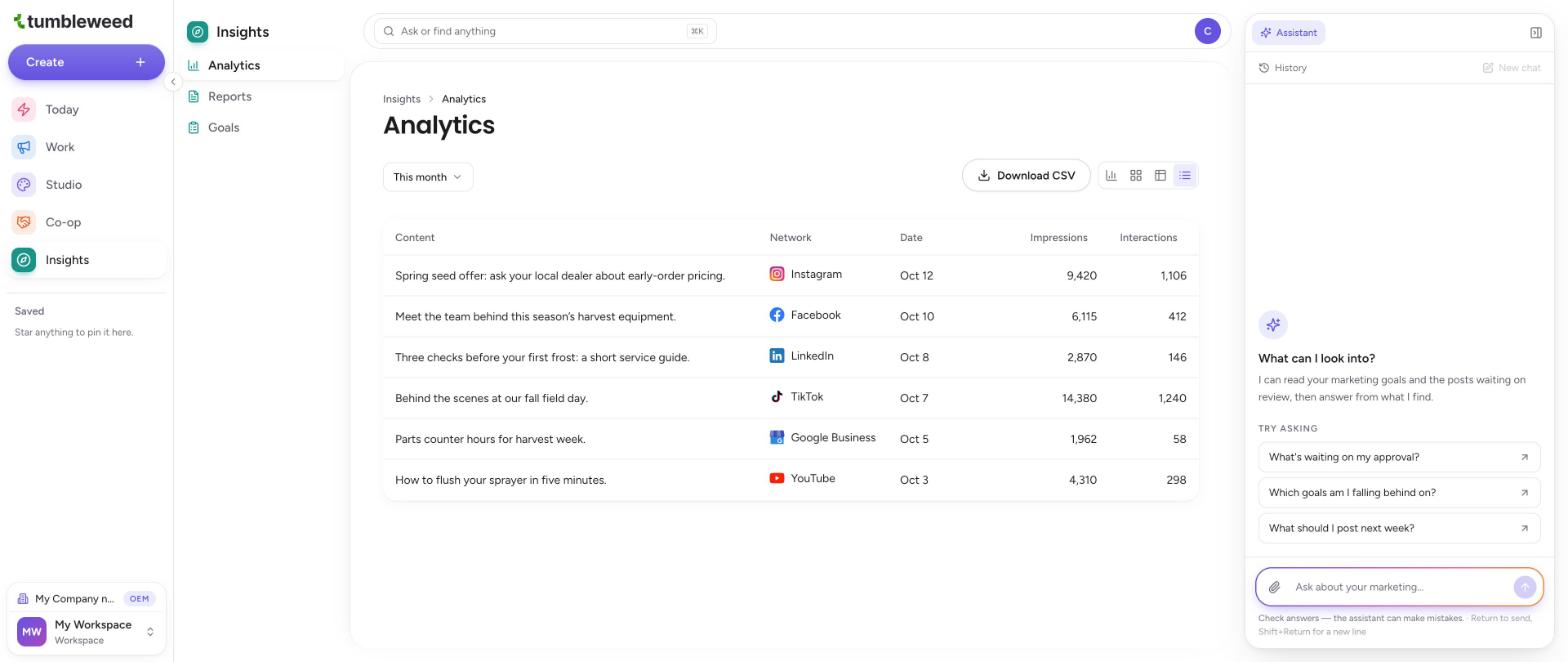
Find your best posts in Posts. The Posts view lists every post in the period with its network, date, impressions, and interactions.
Export the numbers. Select Download CSV to save the data.
The screenshots in this guide use sample numbers. Right after you connect a channel, Analytics says the numbers are on their way. The first numbers arrive after that night's sync, so check back the next day. For a shareable summary, see Download a Performance Report.